MSc Data Analytics
Rennes School of Business — France
Focus: data analytics, statistical modeling, business intelligence and decision-making.
Business Intelligence • Data Analytics • Data Engineering
Delivering BI solutions through reliable data, actionable insights, AI-driven innovation, and measurable business impact.
Power BI, AI, Agent development, SQL, Python, R, Databricks, Power Automate and customer-oriented analytics solutions.
Business Intelligence & Data Analyst with experience delivering analytics solutions for product, operations and technology teams. Skilled in Power BI, SQL, Python and automation, with hands-on work in data validation, KPI reporting, product performance monitoring and stakeholder management. Strong ability to turn operational data into business insights, support solution delivery and help users make data-driven decisions.
Rennes School of Business — France
Focus: data analytics, statistical modeling, business intelligence and decision-making.
Universidad de La Sabana — Colombia
Focus: business strategy, finance, operations, international trade and analytics.
SCOR — Paris, France
Built and maintained Power BI dashboards, automated reporting workflows and analyzed application performance data to help teams monitor KPIs, detect anomalies and improve operational visibility.
Beauty Spa — Bogotá, Colombia
Cleaned and standardized customer and sales data, created Power BI reports and supported customer loyalty analysis through business insights.
Organización Empresarial Prosperar — Bogotá, Colombia
Standardized operational databases and improved data consistency, reducing errors in business reports. Automated recurring Excel processes with VBA, reducing manual processing time by approximately 50%.
A selection of data projects focused on business intelligence, data quality, application performance, automation and decision-making support.
Portfolio category
01
Data quality monitoring solution for underwriting platform migration.
The company was building a new underwriting platform to create a unified system across regions and lines of business. During the migration from the legacy application to the new platform, stakeholders needed a reliable way to detect data accuracy issues, misleading information and recurring migration errors.
The analysis was based on underwriting data extracted from both the legacy application and the new platform. The objective was to compare migrated records, identify inconsistencies and highlight contracts requiring review or correction.
We first worked with underwriters to understand where they were experiencing the most frequent data accuracy issues. After identifying the main error types, I designed SQL queries to extract the required information, apply business logic and validate the accuracy of migrated data.
The final output was a Power BI dashboard that allowed stakeholders to monitor migration quality by line of business, error type and contract. Users could review migration accuracy percentages and quickly identify contracts affected by issues such as pricing inconsistencies or manual input errors.
This solution significantly reduced the time required to identify migration errors and created an intuitive way for users to detect, understand and correct data quality issues during the migration process.
Detailed case study — soon available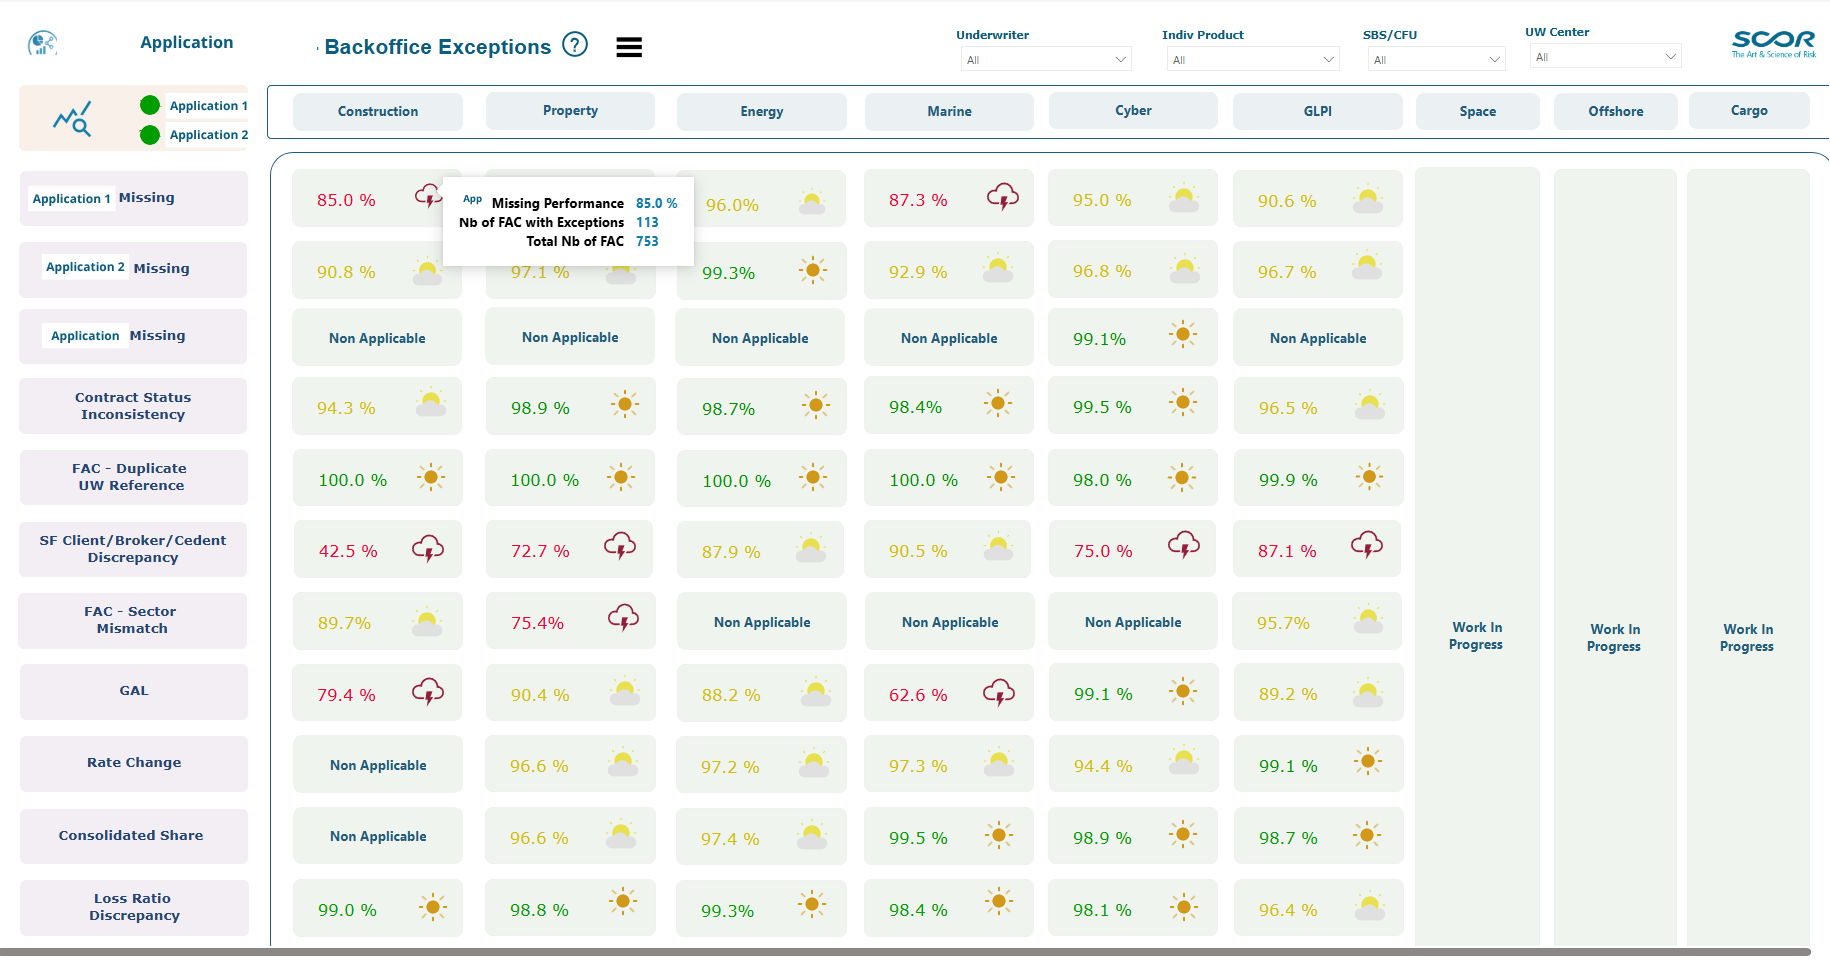
migration_exception_detection.sql
WITH migration_check AS (
    SELECT
        c.line_of_business,
        c.contract_number,
        c.underwriting_year,
        c.pricing_amount AS legacy_pricing,
        n.pricing_amount AS new_platform_pricing,
        c.status AS legacy_status,
        n.status AS new_platform_status,
        c.last_update_date,
        CASE
            WHEN n.contract_number IS NULL THEN 'Missing in New Platform'
            WHEN c.pricing_amount <> n.pricing_amount THEN 'Pricing Mismatch'
            WHEN c.status <> n.status THEN 'Status Mismatch'
            ELSE 'Valid Migration'
        END AS migration_status
    FROM legacy_contracts c
    LEFT JOIN new_platform_contracts n
      ON c.contract_number = n.contract_number
     AND c.underwriting_year = n.underwriting_year
),
quality_summary AS (
    SELECT
        line_of_business,
        migration_status,
        COUNT(*) AS total_contracts,
        ROUND(
            COUNT(*) * 100.0 /
            SUM(COUNT(*)) OVER (PARTITION BY line_of_business),
            2
        ) AS status_percentage,
        COUNT(CASE WHEN migration_status <> 'Valid Migration' THEN 1 END) AS contracts_with_issues
    FROM migration_check
    GROUP BY line_of_business, migration_status
),
ranked_issues AS (
    SELECT
        line_of_business,
        migration_status,
        total_contracts,
        status_percentage,
        RANK() OVER (
            PARTITION BY line_of_business
            ORDER BY total_contracts DESC
        ) AS issue_rank
    FROM quality_summary
)
SELECT
    line_of_business,
    migration_status,
    total_contracts,
    status_percentage,
    issue_rank
FROM ranked_issues
WHERE migration_status <> 'Valid Migration'
ORDER BY line_of_business, issue_rank;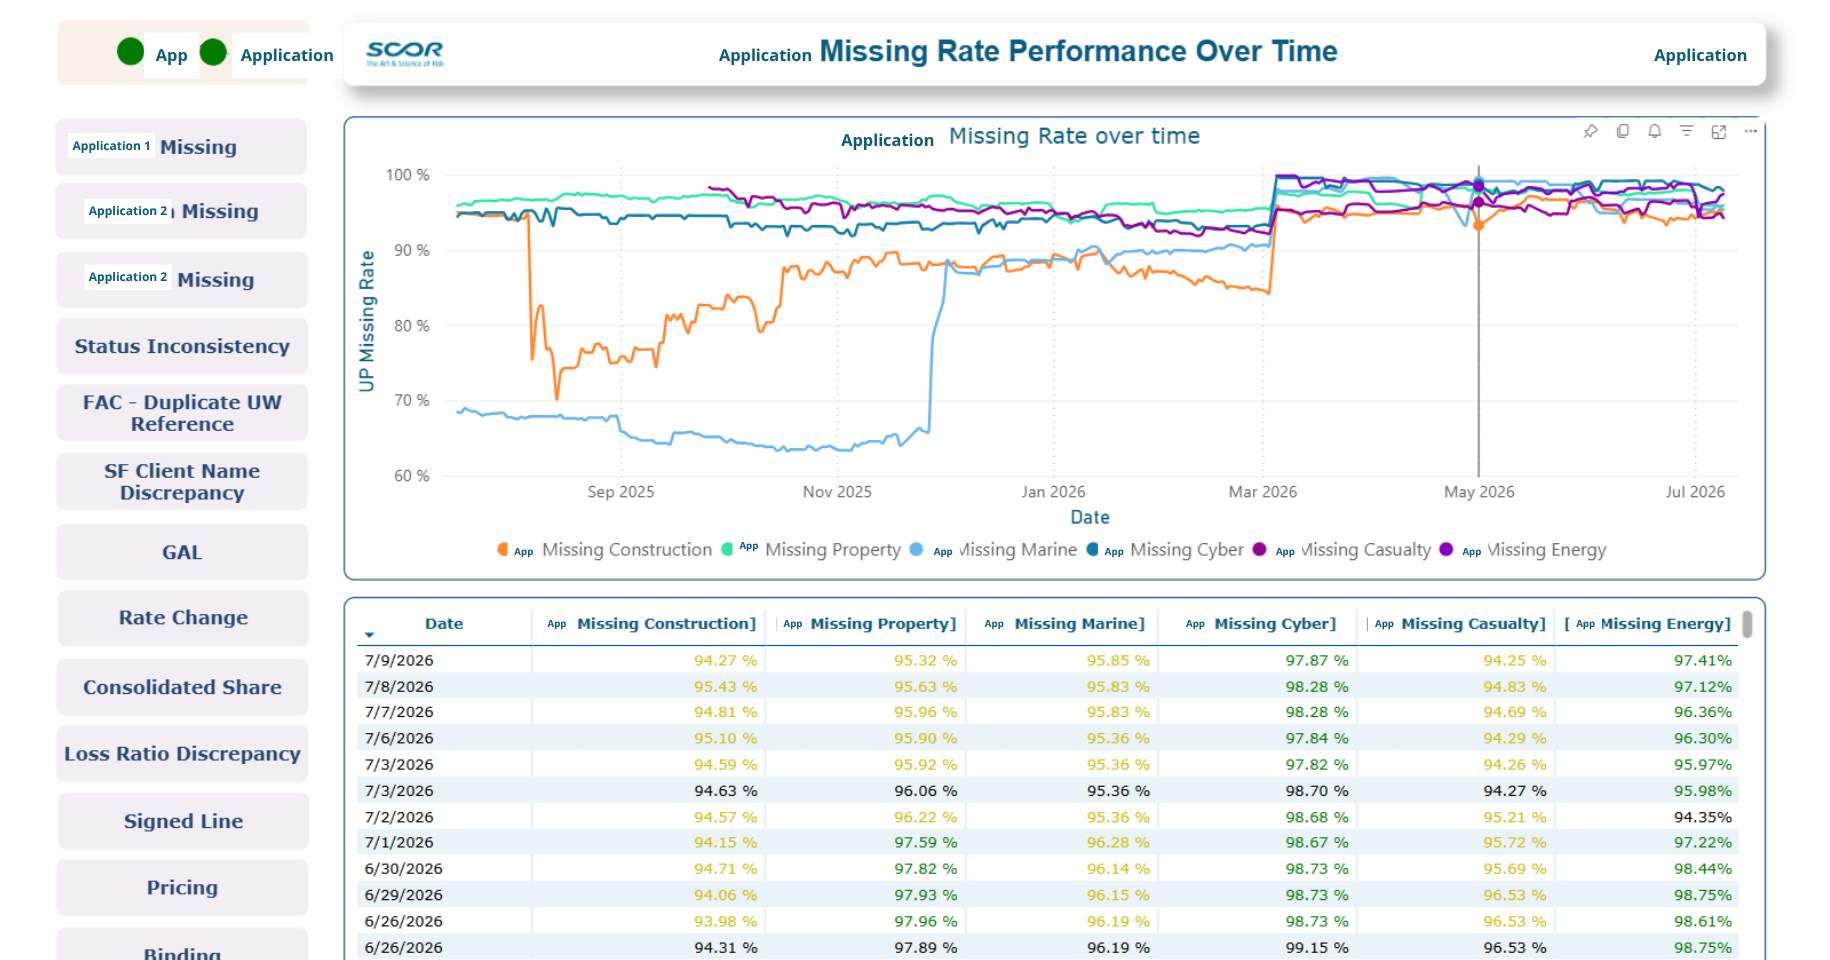
02
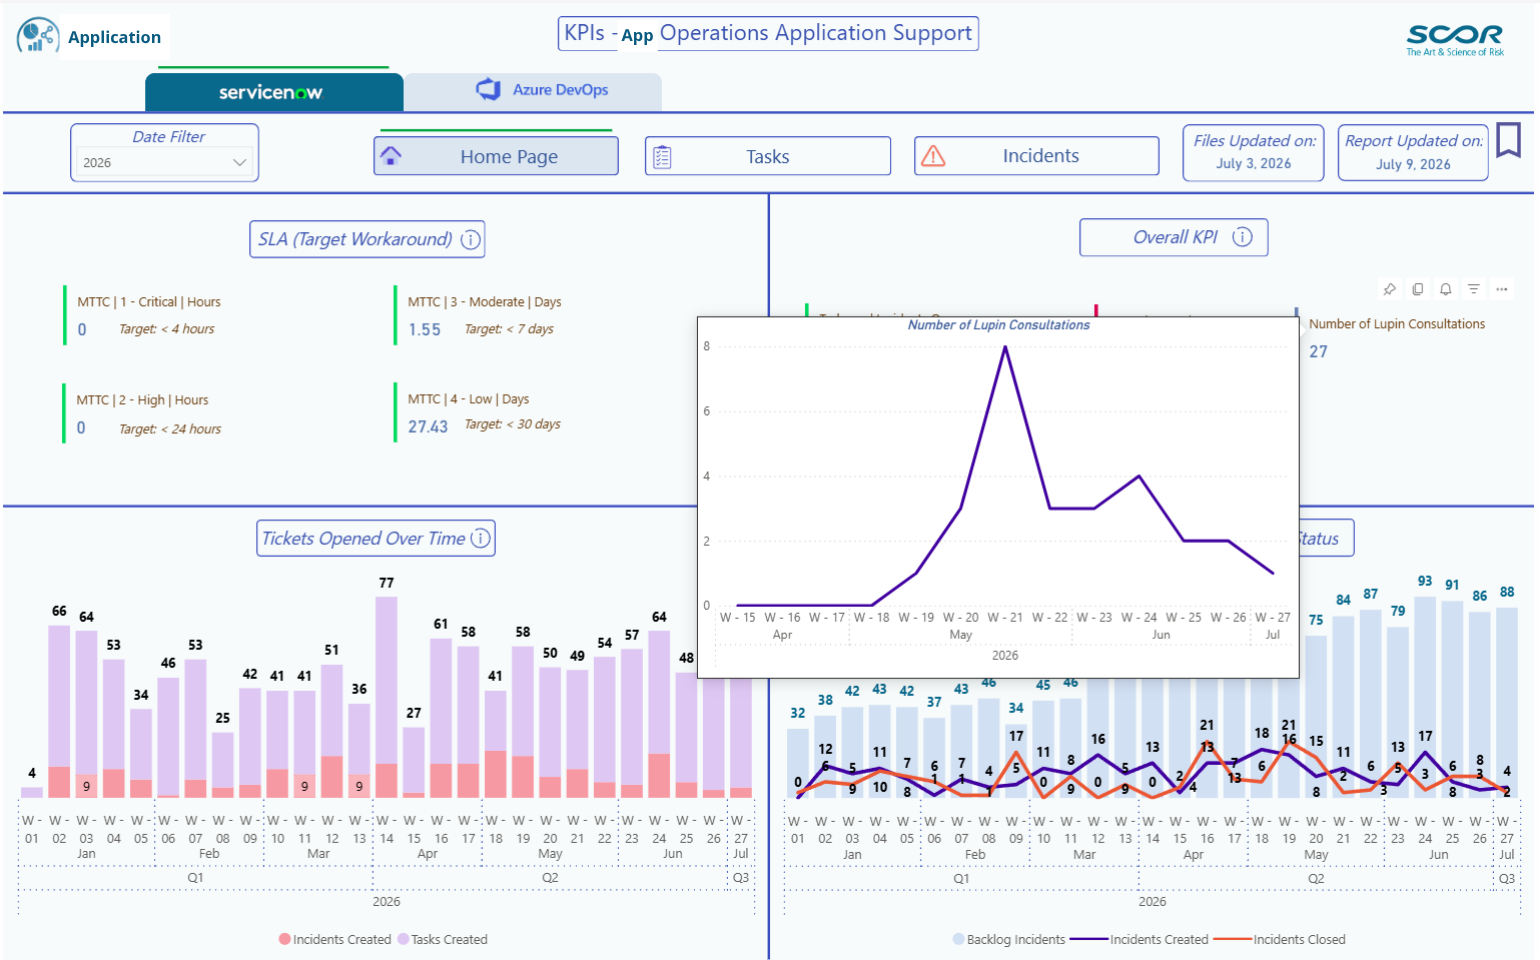
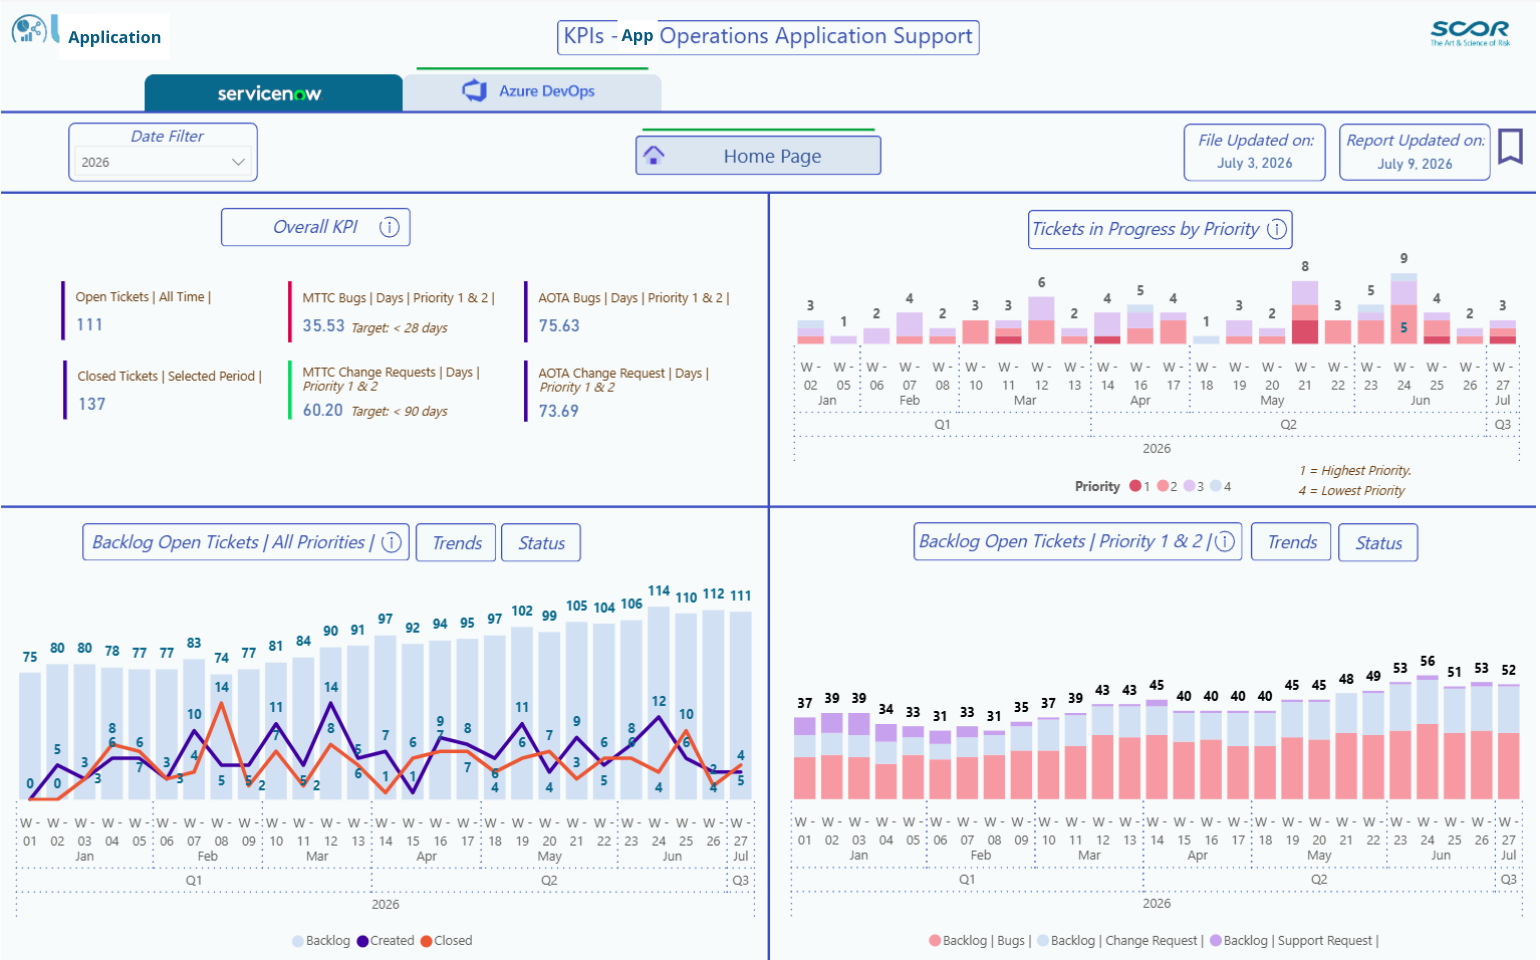
Application support and SLA monitoring dashboard.
While managing several applications at the same time, the team needed an effective way to measure application support performance from a user-oriented perspective. The goal was to track SLA performance, user tickets, issue types, response times and the overall quality of application maintenance.
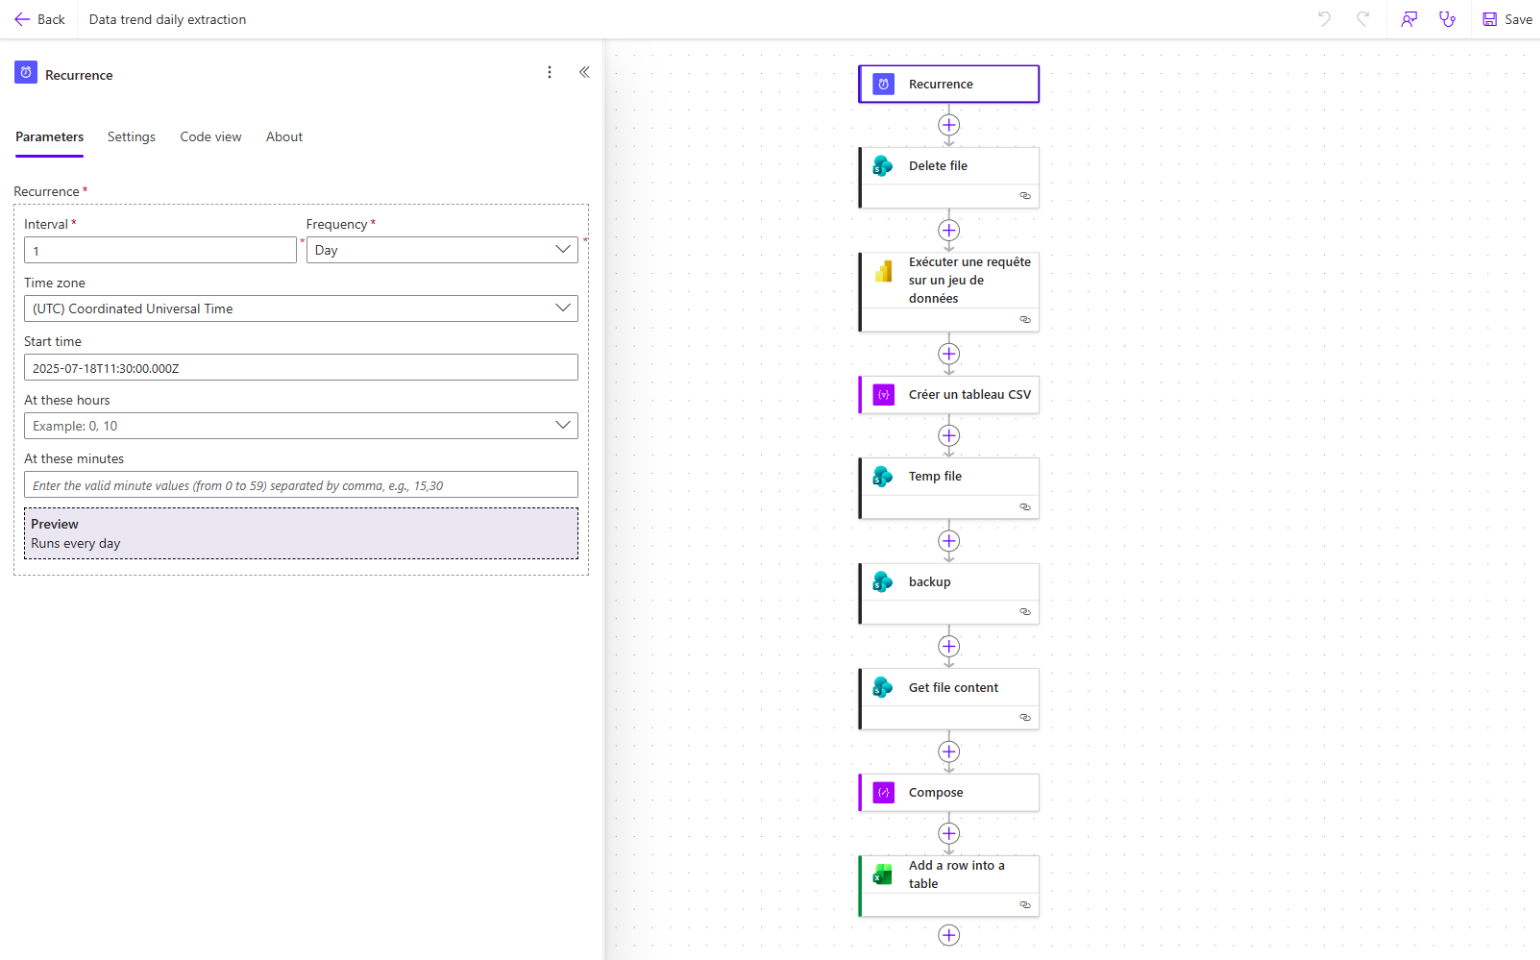
The dashboard used data from ServiceNow and Azure DevOps, including user tickets, issue categories, application references, response times, resolution status and support activity.
We began by defining the KPIs needed to evaluate application maintenance. After identifying the right KPIs, I selected and structured the available data, created Power BI measures and designed visuals that allowed the team to follow application performance in a simple and consistent way.
The dashboard made application follow-up easier and more intuitive for the team. It also provided a clear and concise way to explain application maintenance performance to management and support operational decisions.
The final solution was an interactive Power BI dashboard that centralized key maintenance indicators and helped the team monitor application performance, ticket management and SLA compliance.
Detailed case study — soon available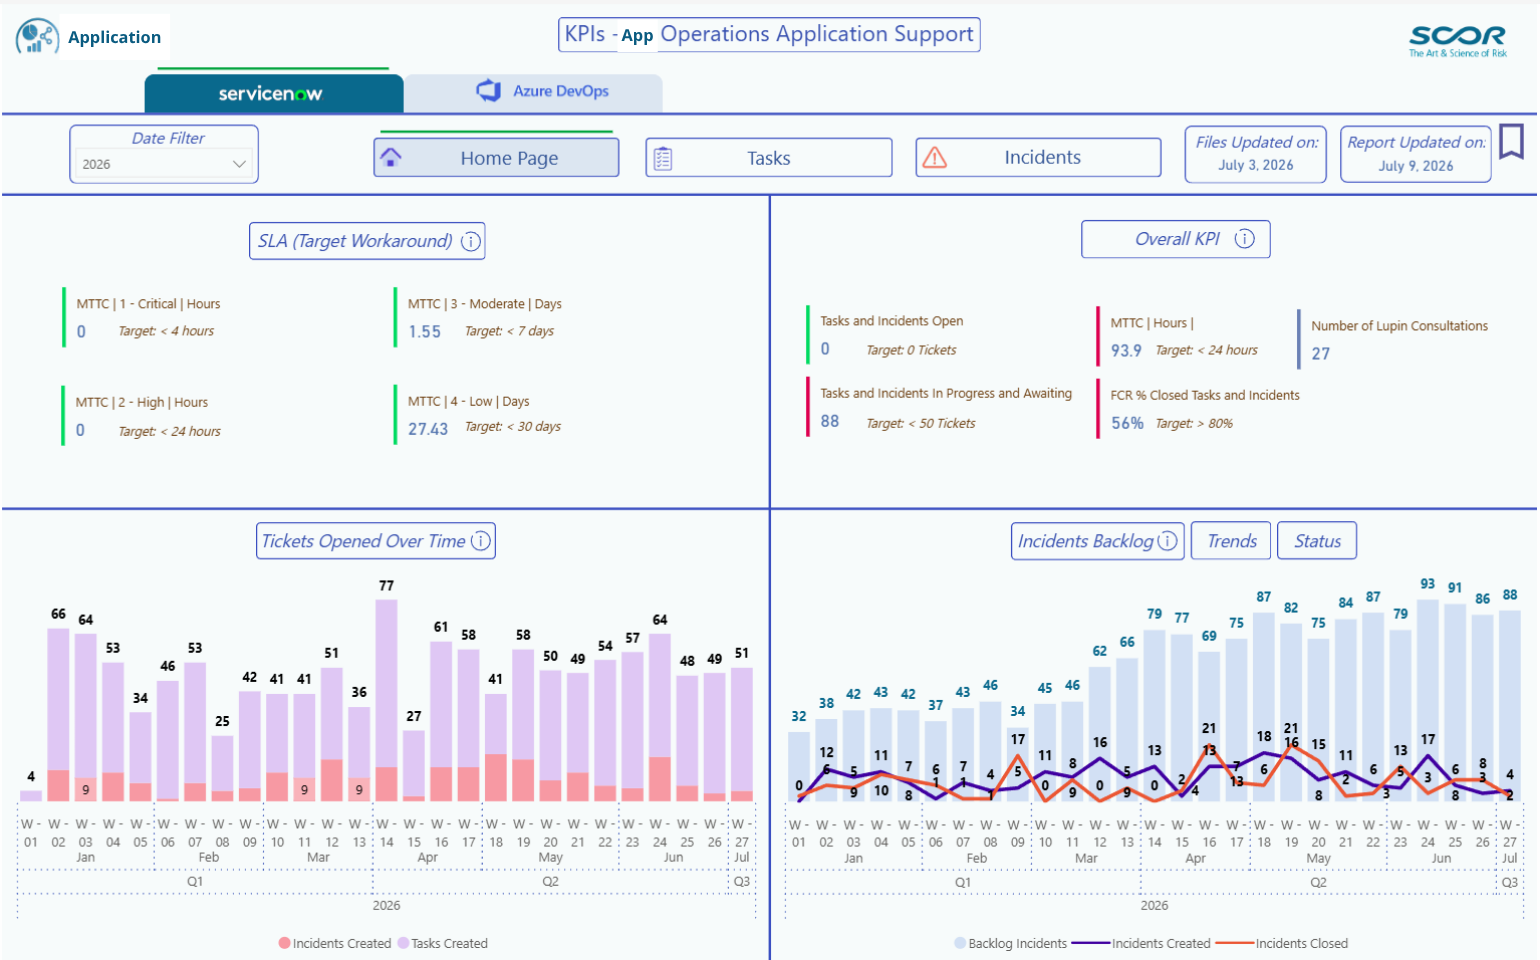
03
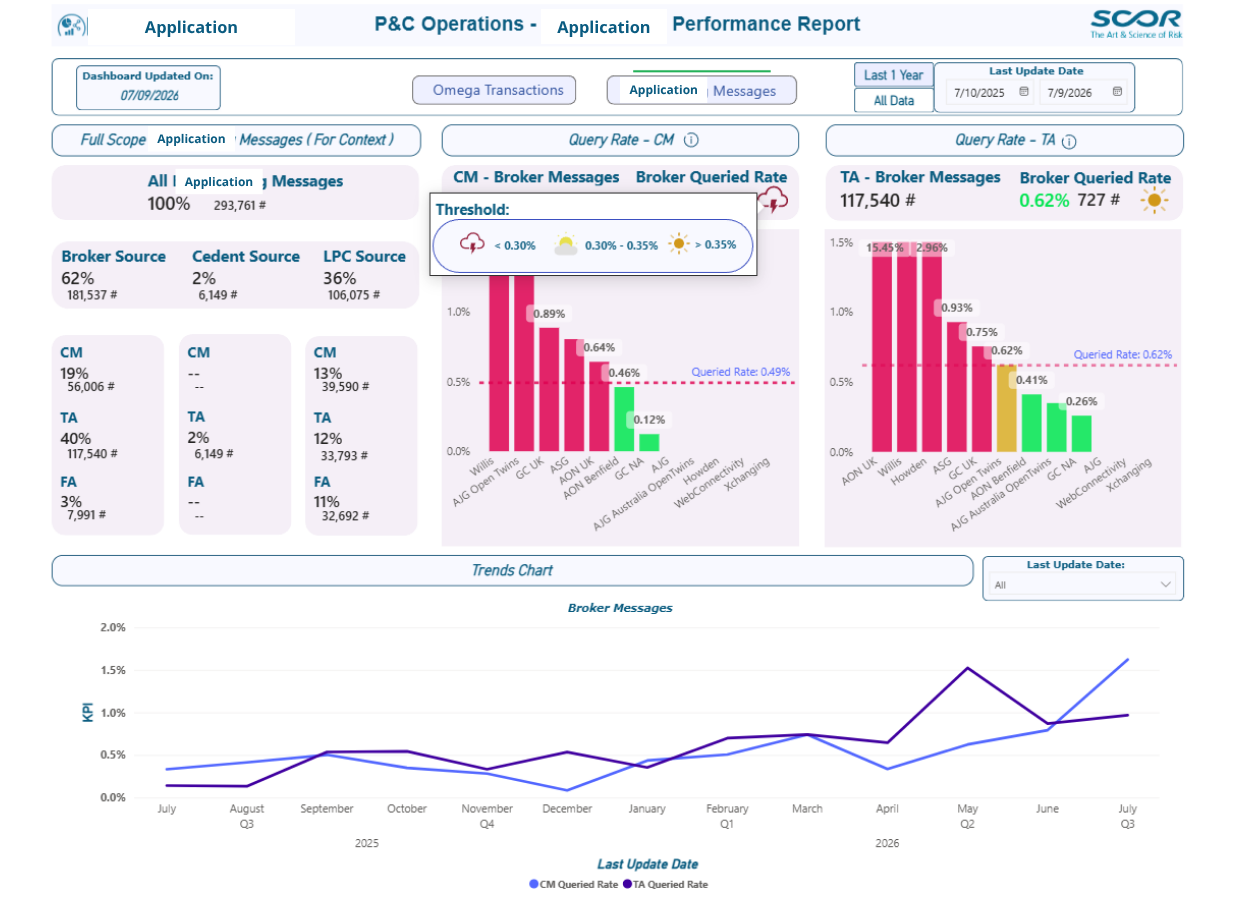
Performance monitoring dashboard designed to translate complex transaction data into clear business KPIs.
The team needed to measure the performance of a complex internal application. The main challenge was translating highly technical transaction processing data into simple, readable and business-oriented KPIs that could be understood by product teams and management.
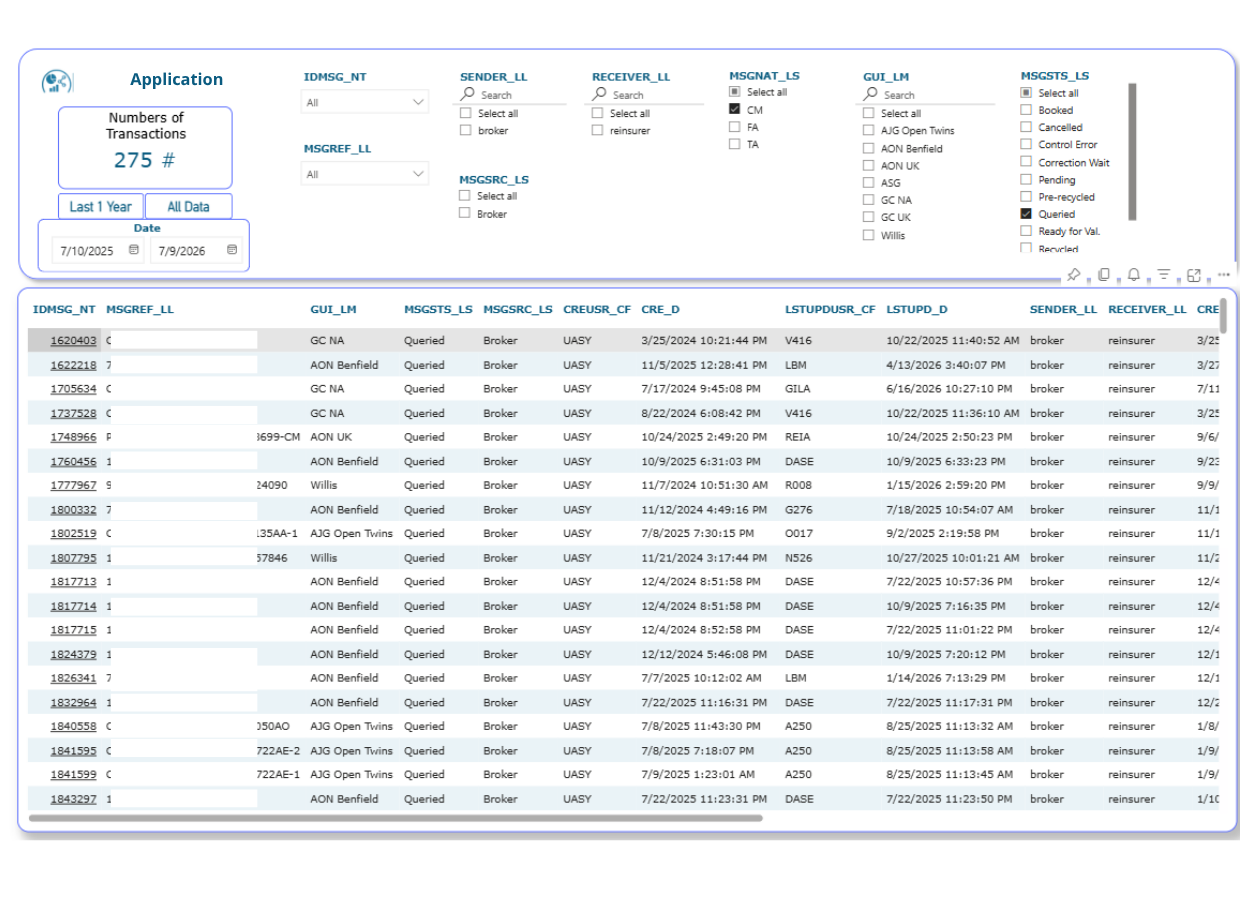
The analysis used transaction, contract, message and accounting-related data extracted from Databricks. SQL queries were developed to structure the data and create the foundation for Power BI measures and visuals.
We started by defining the KPIs with the Head of Application. Then, I reviewed the available data in Databricks, identified missing fields and developed SQL logic to extract the information needed for the dashboard.
After preparing the dataset, I built Power BI measures and designed the dashboard to present application performance, transaction origin, message status and business activity in a clear and explainable way.
Collaboration between the Data Analyst and the Head of Application was essential. Defining the right KPIs and agreeing on how to display them helped transform a complex operational process into an intuitive monitoring solution.
The final dashboard helped monitor application performance, identify operational patterns and communicate complex transaction behavior in a simple way.
Detailed case study — soon available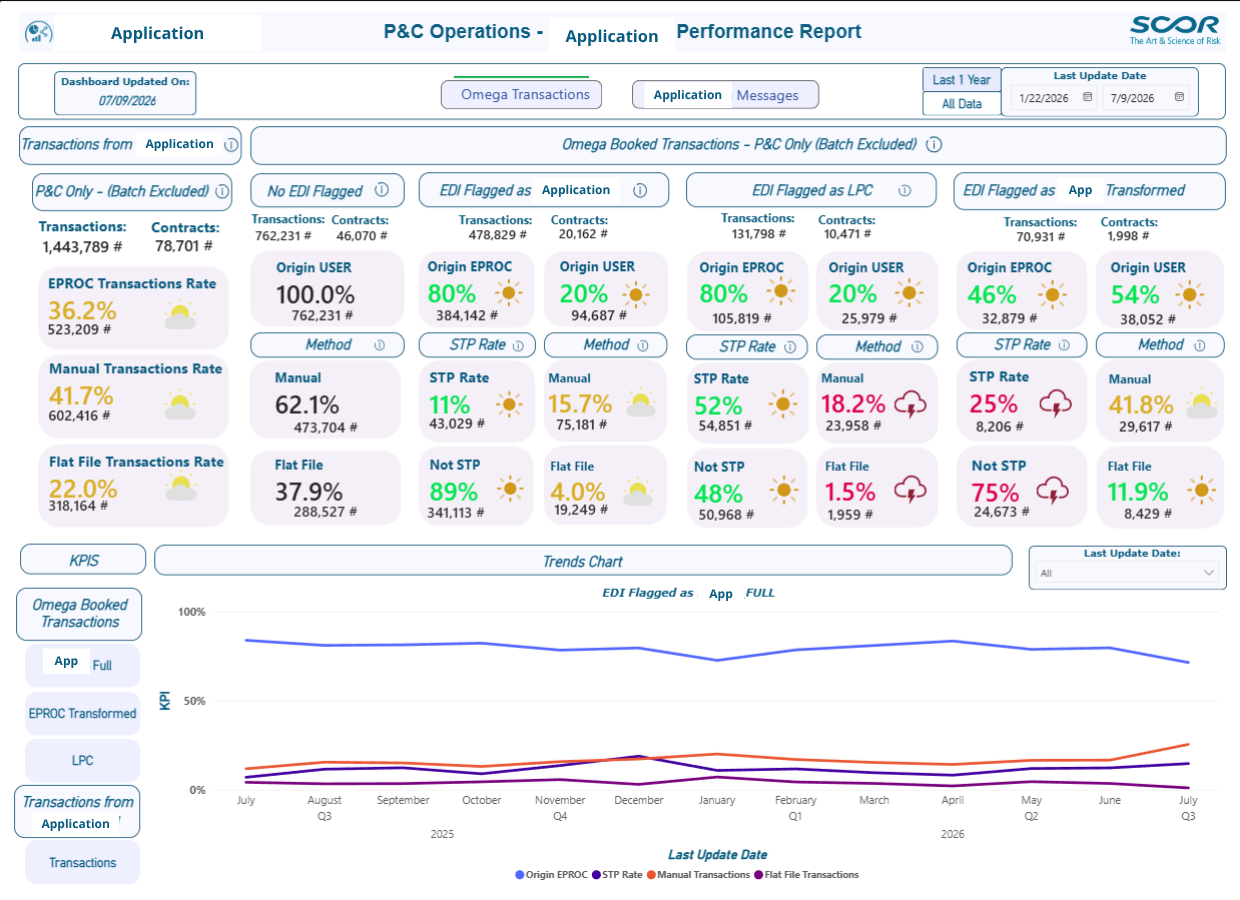
transaction_processing_kpis.sql
SELECT
    transaction_date,
    transaction_number,
    contract_number,
    transaction_code,
    CASE
        WHEN message_id IS NOT NULL THEN 'Electronic Processing'
        WHEN update_user IN ('AUTO', 'BATCH') THEN 'Batch'
        ELSE 'Manual'
    END AS transaction_origin,
    message_status,
    business_activity,
    original_currency_amount
FROM accounting_transactions
WHERE transaction_date >= DATE('2024-01-01');
Portfolio category
Soon Available
Soon Available
Projects focused on pipelines, automation, data modeling and data quality workflows.
Portfolio category
Soon Available
Soon Available
Projects focused on forecasting, machine learning and statistical modeling.
Portfolio category
Soon Available
Soon Available
Projects focused on Excel, financial KPIs, profitability, pricing and business performance.